
We use the data from sklearn library, and the IDE is sublime text3. Most of the code comes from the book: https://www.goodreads.com/book/show/32439431-introduction-to-machine-learning-with-python?from_search=true
###There is a class of algorithms for visualization called manifold learning algorithms
###which allows for much more complex mappings, and often provides better visualizations compared with PCA.
###A particular useful one is the t-SNE algorithm.
from sklearn.datasets import load_digits
import numpy as np
import matplotlib.pyplot as plt
from sklearn.model_selection import train_test_split
from sklearn.decomposition import PCA
colors = ["#476A2A", "#7851B8", "#BD3430", "#4A2D4E", "#875525",
"#A83683", "#4E655E", "#853541", "#3A3120","#535D8E"]
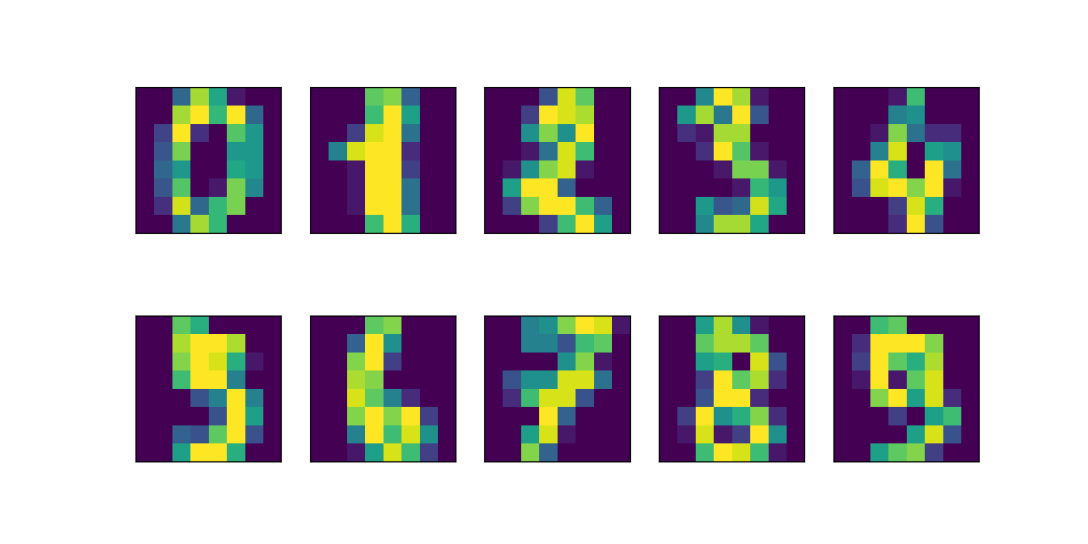
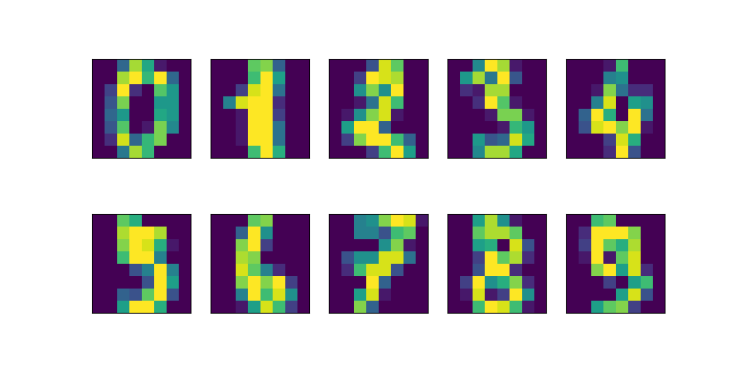
###1. Plot the digits from sklearn
import pandas as pd
digits=load_digits()
fig,axes=plt.subplots(2,5,figsize=(10,5), subplot_kw={'xticks':(),'yticks':()})
for ax,img in zip(axes.ravel(),digits.images):
ax.imshow(img)
plt.show()
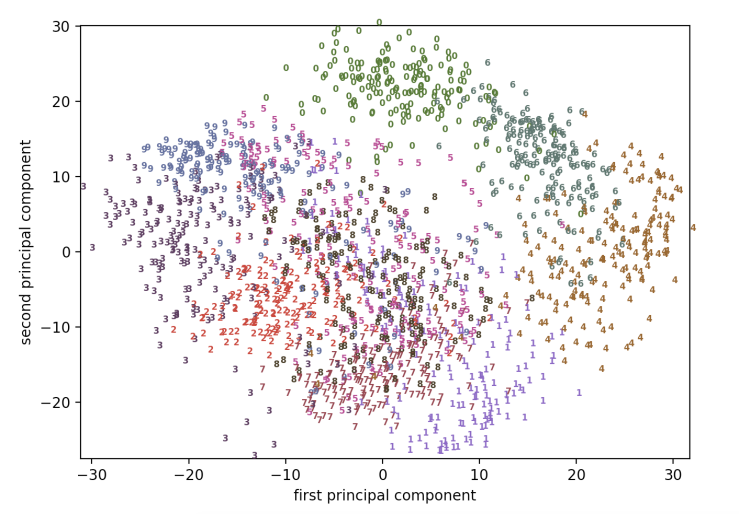
###2. PCA
pca=PCA(n_components=2)
digits01=digits.data
pca.fit(digits01)
digits_pca = pca.transform(digits01)
def rstr(df):
	return df.shape, df.apply(lambda x:[x.unique()])
print('\n''structure of data:''\n',
	rstr(pd.DataFrame(digits.data)))

plt.figure(figsize=(10, 10))
plt.xlim(digits_pca[:, 0].min(), digits_pca[:, 0].max())
plt.ylim(digits_pca[:, 1].min(), digits_pca[:, 1].max())
for i in range(len(digits.data)):
    # actually plot the digits as text instead of using scatter
    plt.text(digits_pca[i, 0], digits_pca[i, 1], str(digits.target[i]),
             color = colors[digits.target[i]],
             fontdict={'weight': 'bold', 'size': 6})
plt.xlabel("first principal component")
plt.ylabel("second principal component")
plt.show()
###3. plot with t_SNE
from sklearn.manifold import TSNE
tsne = TSNE(random_state=42,perplexity=50)
digits02=digits.data
# use fit_transform instead of fit, as TSNE has no transform method:
digits_tsne = tsne.fit_transform(digits02)
plt.figure(figsize=(10, 10))
plt.xlim(digits_tsne[:, 0].min(), digits_tsne[:, 0].max() + 1)
plt.ylim(digits_tsne[:, 1].min(), digits_tsne[:, 1].max() + 1)
for i in range(len(digits.data)):
    # actually plot the digits as text instead of using scatter
    plt.text(digits_tsne[i, 0], digits_tsne[i, 1], str(digits.target[i]),
             color = colors[digits.target[i]],
             fontdict={'weight': 'bold', 'size': 9})
plt.show()
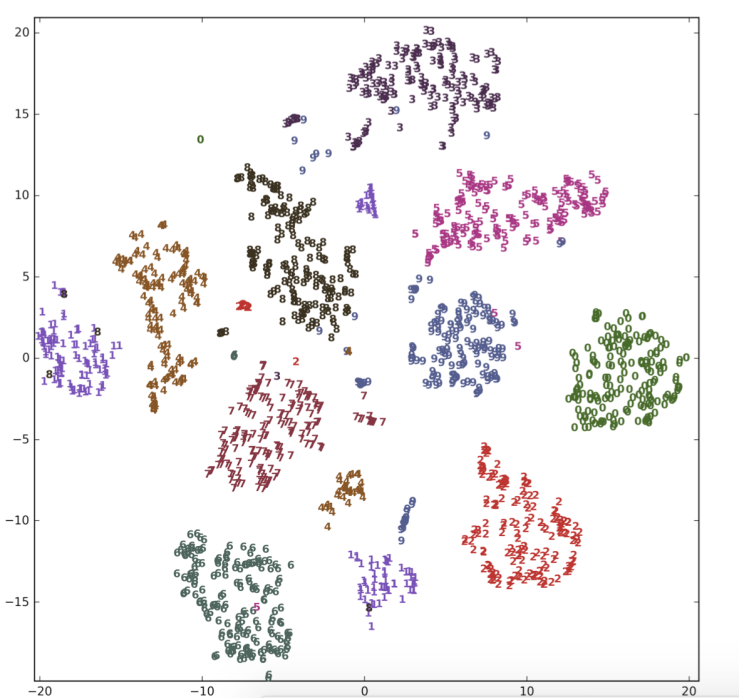
We can see more about TSNE here: http://distill.pub/2016/misread-tsne/
